Building an Interactive ECG Waveform
Creating an interactive component to help teach the different waves, intervals and segments.
The Idea
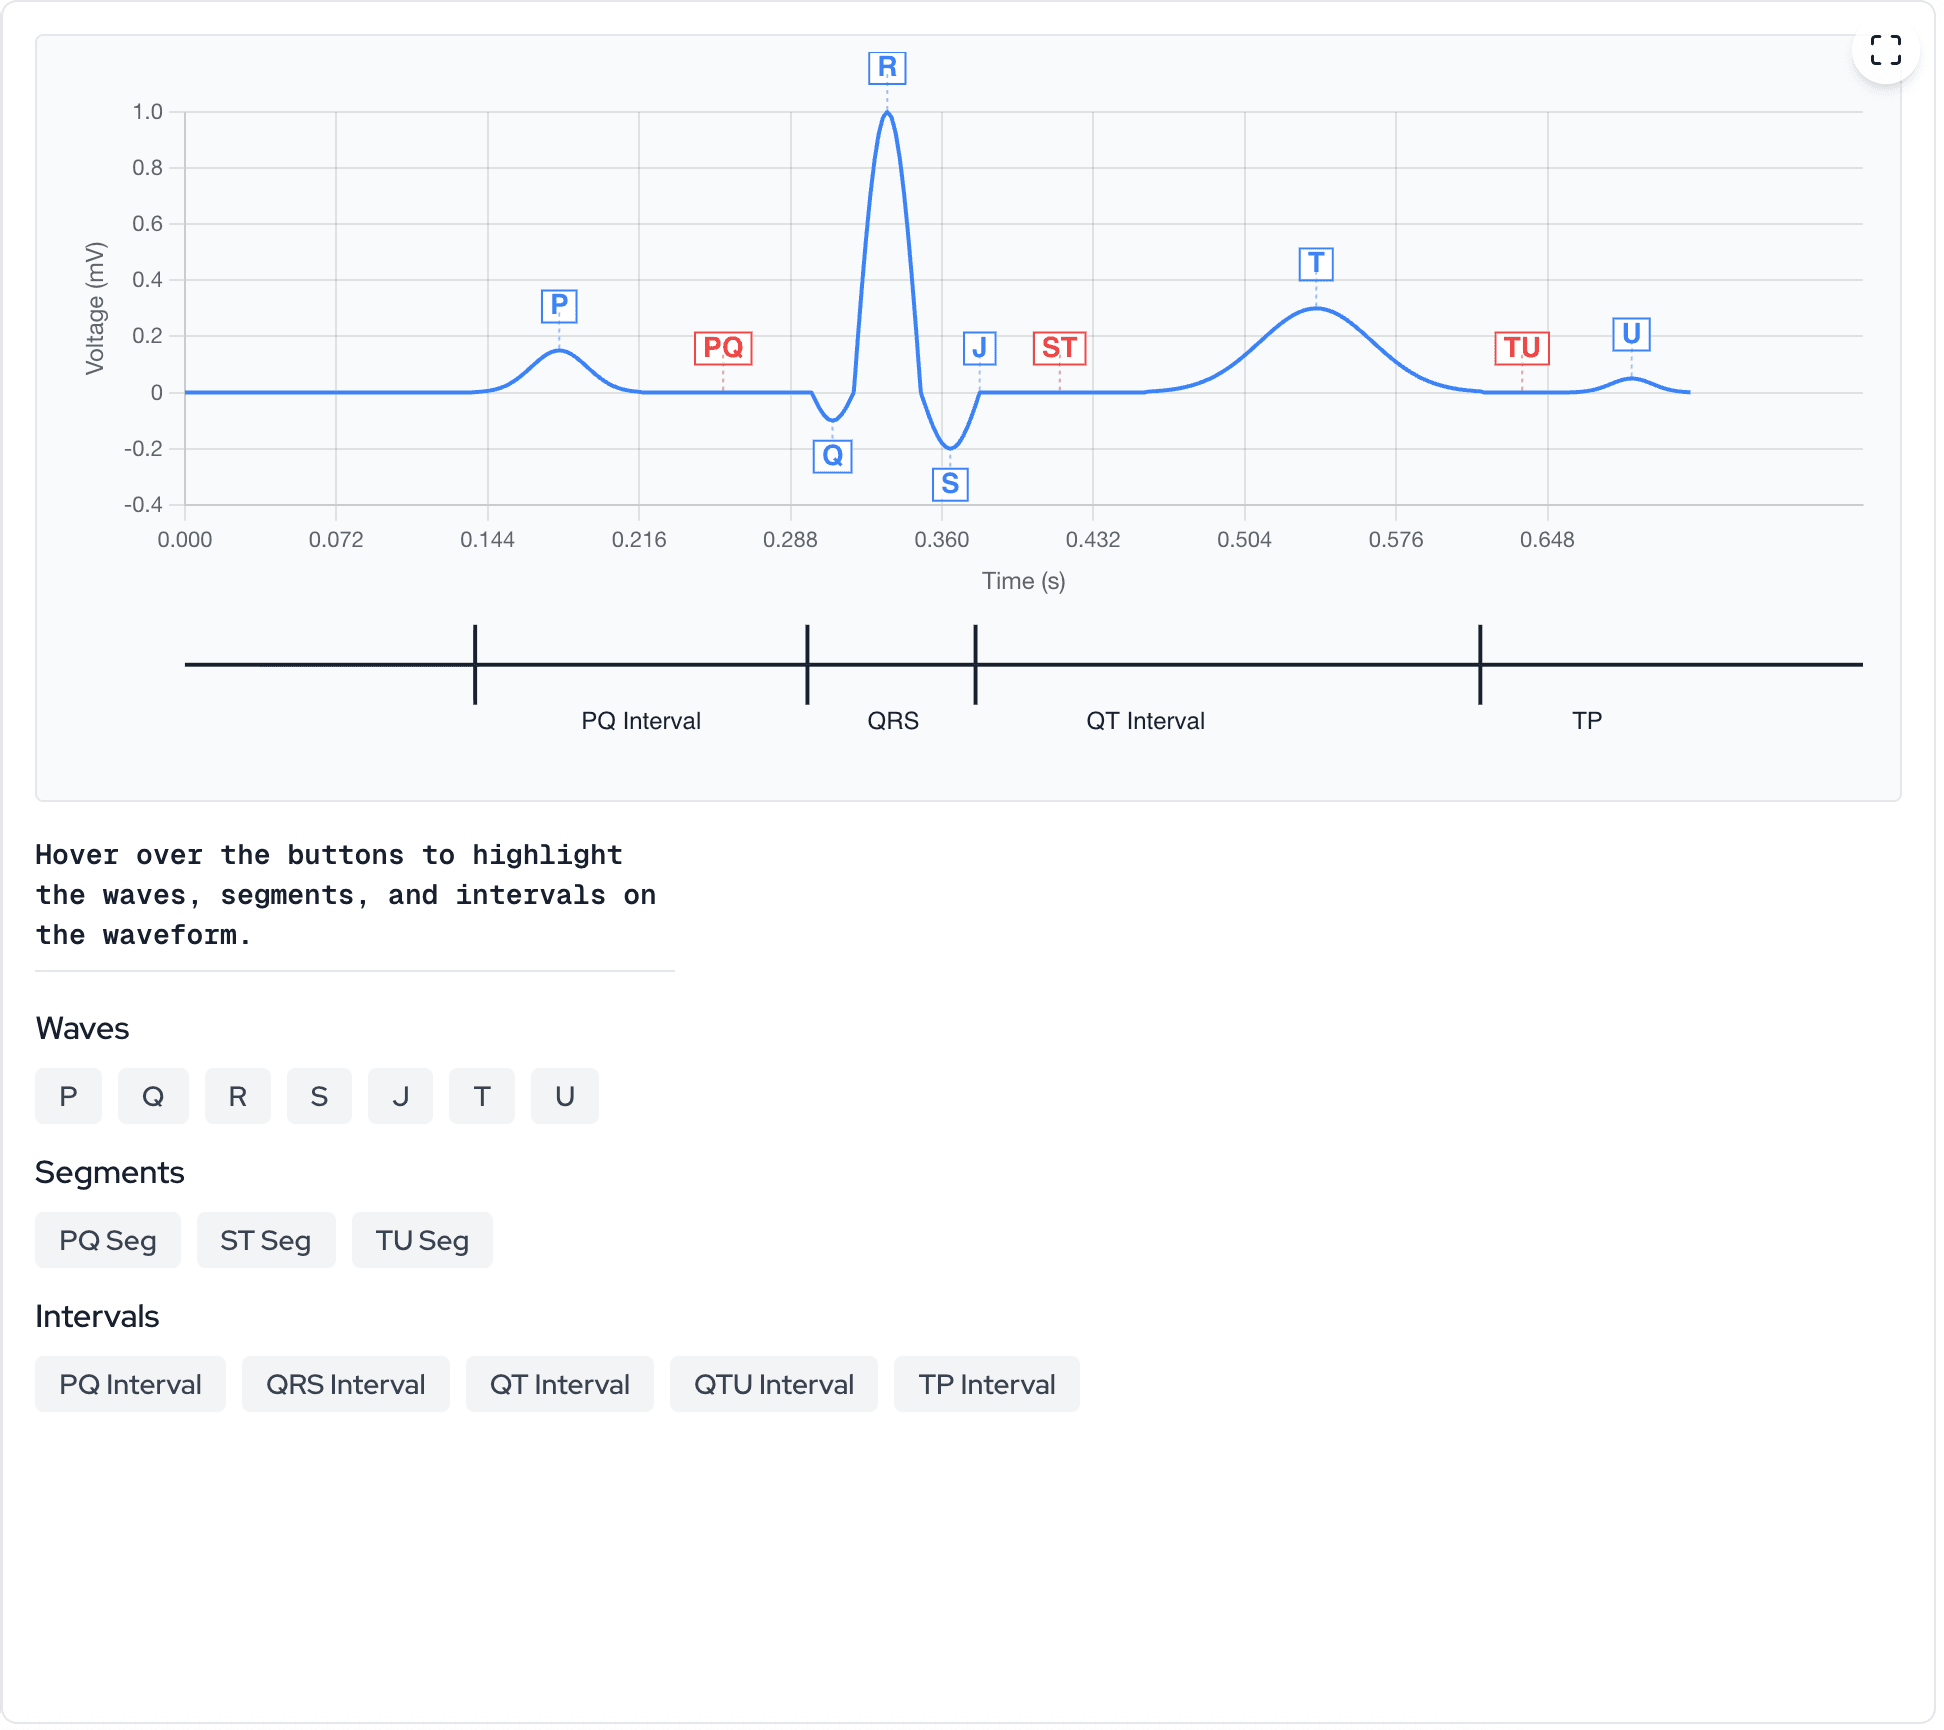
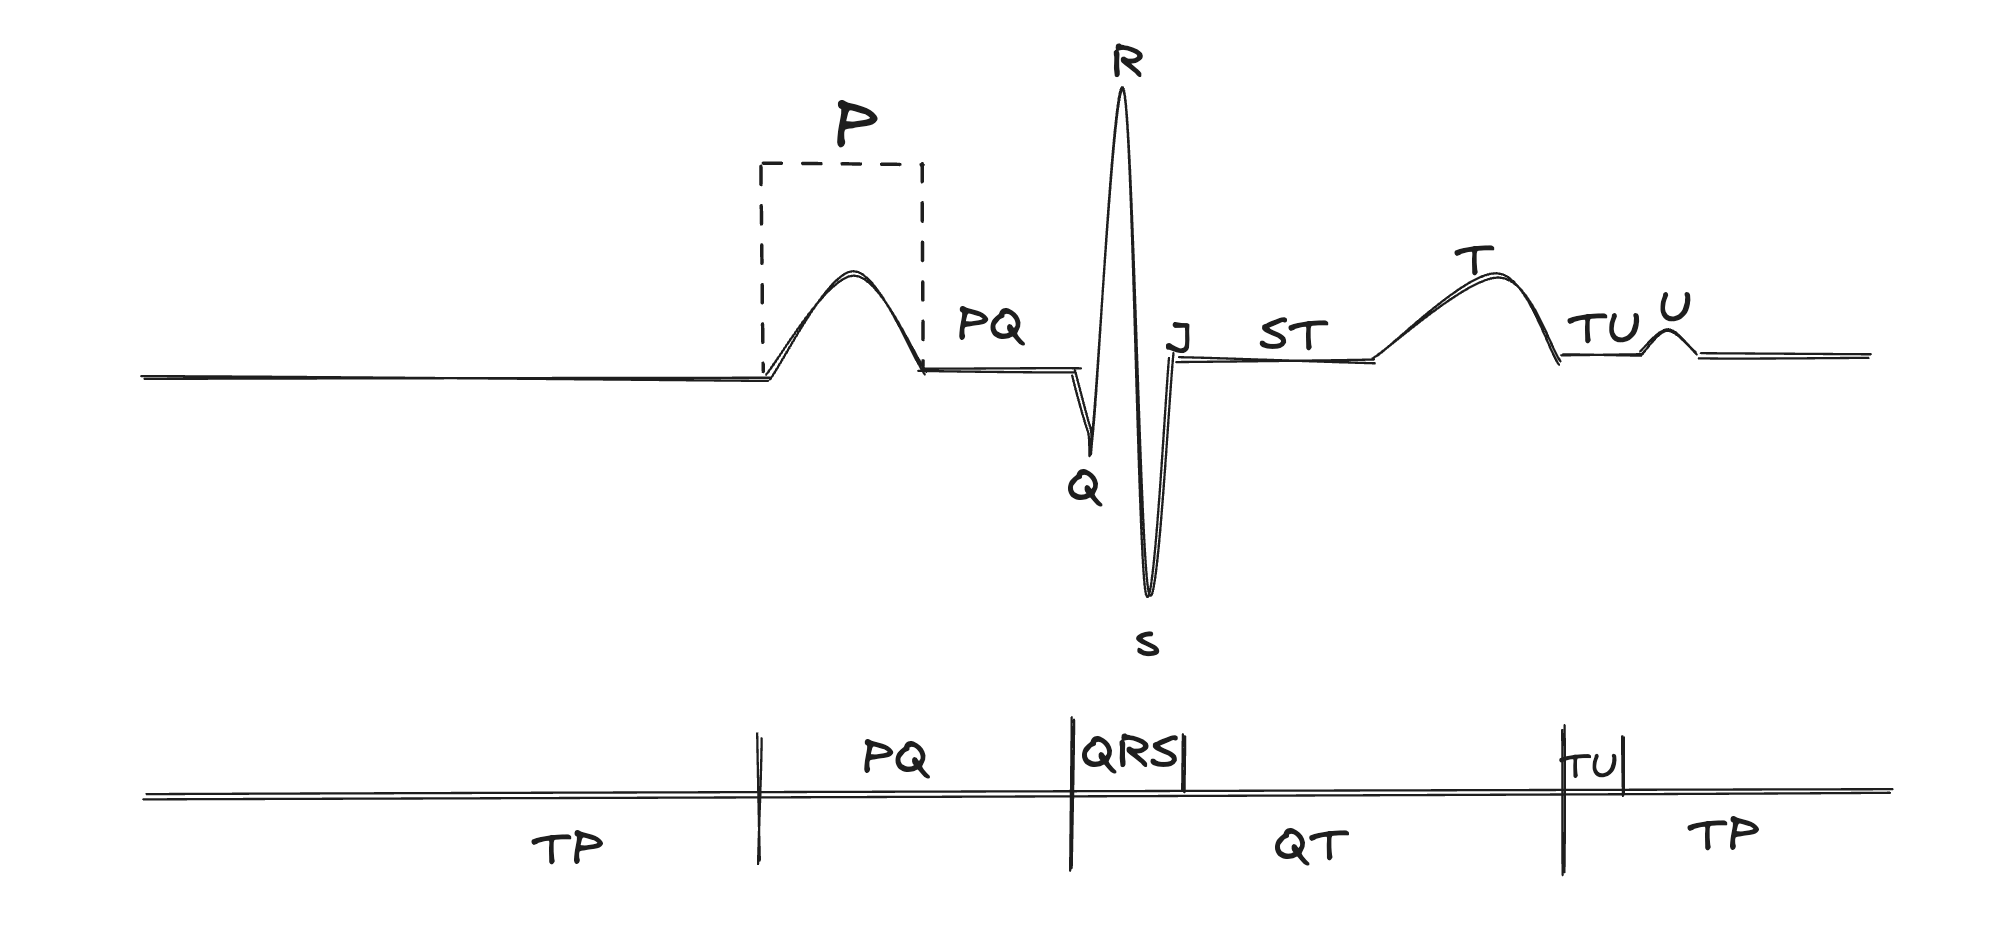
The goal was simple: create a waveform where users could hover over interactive buttons and immediately see the corresponding region highlighted on the actual ECG tracing. I started with a sketch in Excalidraw, mapping out how the interface would potentially work with buttons organized by category (waves, segments, intervals), with each category using a distinct highlight color.
Design Philosophy
The key insight from the initial design was that every data point in the waveform needs to "know" which region it belongs to. This metadata is what enables per-point highlighting and makes the interactions feel immediate rather than calculated on-the-fly.
Quick Primer on ECG Terminology
Before diving into code, let's clarify the terminology that drives the entire component architecture.
Clinical Note
In clinical practice, the distinction between waves, segments, and intervals is critical for diagnosis. A prolonged QT interval suggests risk of arrhythmias. ST segment elevation or depression can indicate myocardial infarction or ischemia. Confusing these terms can lead to missed diagnoses.
- Waves (P, Q, R, S, T, U) — Deflections above or below baseline. P = atrial depolarization; QRS = ventricular depolarization; T = ventricular repolarization; U = late repolarization (subtle, often absent).
- Segments (PQ, ST, TU)— Flat, isoelectric periods between waves. The ST segment is particularly important—elevation or depression here is a key marker for acute coronary syndromes.
- Intervals (PR, QRS, QT) — Composite measurements that include both waves and segments. PR interval = P wave + PQ segment. QT interval = QRS + ST segment + T wave.
- J-point — The junction where the QRS complex ends and the ST segment begins. Critical for measuring ST elevation/depression.
The Data Architecture
The foundation of the interactive highlighting system is a simple idea: every data point is tagged with its region. When we generate the waveform, we don't just create X and Y arrays, we also create a parallel array that tracks what ECG region each point belongs to.
1// The waveform data structure2const data: {3 time: number[]; // X-axis values (seconds)4 voltage: number[]; // Y-axis values (millivolts)5 regions: ActiveRegion[]; // What region each point belongs to6} = {7 time: new Array(totalSamples),8 voltage: new Array(totalSamples),9 regions: new Array(totalSamples),10};11 12// Example: as we generate each point13data.time[currentIdx] = currentTime;14data.voltage[currentIdx] = voltageValue;15data.regions[currentIdx] = "P"; // This point is part of the P waveEvery data point knows its ECG region which enables instant highlighting.
This approach means that when a user hovers over "P wave", we can instantly identify every point in the array where `regions[i] === "P"` and highlight just those segments. No calculations are needed and the data tells us exactly what to highlight.
Type-Safe Domain Modeling
TypeScript union types are perfect for modeling the ECG domain. By explicitly defining all possible region types, we get compile-time safety and self-documenting code. The type system prevents us from accidentally creating an invalid region like "PR" when we meant "PQ".
1// Types for active regions2type WaveType = "P" | "Q" | "R" | "S" | "T" | "U" | "J";3type SegmentType = "PQ" | "ST" | "TU" | "TP";4type IntervalType = "PQ-interval" | "QRS" | "QT" | "QTU" | "TP-interval";5type MeasurementIntervalType = "R-R" | "P-P";6 7type ActiveRegion =8 | WaveType9 | SegmentType10 | IntervalType11 | MeasurementIntervalType12 | null;Union types make the highlighting logic type-safe and self-documenting.
Generating Waveforms
Real ECG waveforms have characteristic shapes: smooth, rounded P and T waves contrasting with the sharp, spiky QRS complex. To replicate these shapes mathematically, we use different generation strategies for each component.
Gaussian Curves for Smooth Waves
The P wave, T wave, and U wave are generated using Gaussian (bell curve) functions. This works well to mimic how electrical depolarization spreads through cardiac tissue. The depolarization starts slowly, accelerates through the middle of the wave, and tapers off at the end.
1// Helper to generate Gaussian-like curve for smooth waves2const gaussian = (3 x: number,4 amplitude: number,5 center: number,6 width: number7): number => {8 return (9 amplitude * Math.exp(-Math.pow(x - center, 2) / (2 * Math.pow(width, 2)))10 );11};12 13// P Wave generation14const pSamples = Math.floor(pWaveDuration * samplingRate);15const pCenter = pSamples / 2;16for (let i = 0; i < pSamples; i++) {17 data.voltage[currentIdx] = gaussian(18 i,19 waveParams.pWaveHeight,20 pCenter,21 pSamples / 6 // Width parameter controls the "spread"22 );23 data.regions[currentIdx] = "P";24}The Gaussian function creates the characteristic rounded shape of P and T waves.
Sine Waves for the QRS Complex
The QRS complex needs sharper deflections. The rapid ventricular depolarization produces distinctive spikes. We use half-sine waves to create these sharper transitions, with each component (Q, R, S) generated separately with its own amplitude and direction. It is not identical to a real ECG but it does the trick for this early learning module.
1// QRS Complex - Three sequential sine-based waves2const qrsSamples = Math.floor(qrsDuration * samplingRate);3const qSamples = Math.floor(qrsSamples * 0.25);4const rSamples = Math.floor(qrsSamples * 0.4);5const sSamples = qrsSamples - qSamples - rSamples;6 7// Q wave - small negative deflection8for (let i = 0; i < qSamples; i++) {9 const progress = i / qSamples;10 data.voltage[currentIdx] = waveParams.qAmplitude * Math.sin(progress * Math.PI);11 data.regions[currentIdx] = "Q";12}13 14// R wave - tall positive deflection15for (let i = 0; i < rSamples; i++) {16 const progress = i / rSamples;17 data.voltage[currentIdx] = waveParams.rAmplitude * Math.sin(progress * Math.PI);18 data.regions[currentIdx] = "R";19}20 21// S wave - negative return to baseline22for (let i = 0; i < sSamples; i++) {23 const progress = i / sSamples;24 data.voltage[currentIdx] = waveParams.sAmplitude * Math.sin(progress * Math.PI);25 data.regions[currentIdx] = "S";26}Half-sine waves create the sharp QRS deflections characteristic of ventricular depolarization.
Configurable Parameters
The waveform parameters are based on normal sinus rhythm values. These aren't arbitrary numbers—they correspond to clinically significant measurements that physicians check when reading real ECGs.
1// Default parameters for a normal sinus rhythm2const DEFAULT_PARAMS: Required<WaveformParams> = {3 heartRate: 75, // beats per minute4 pWaveHeight: 0.15, // mV (normal < 0.25 mV)5 qrsHeight: 1.0, // mV6 qAmplitude: -0.1, // mV (small negative deflection)7 rAmplitude: 1.0, // mV (tall positive spike)8 sAmplitude: -0.2, // mV (negative deflection)9 tWaveHeight: 0.3, // mV10 uWaveHeight: 0.05, // mV (subtle, often not visible)11 prInterval: 0.16, // seconds (normal: 0.12-0.20s)12 stSegment: 0.08, // seconds13 tuSegment: 0.04, // seconds14 numberOfBeats: 2, // how many complete cycles to show15};Parameters based on normal sinus rhythm. The PR interval (0.16s) falls within the normal range of 120-200ms.
Clinical Correlation
These parameters have diagnostic significance. A PR interval > 200ms indicates first-degree AV block. A QT interval > 440-460ms (corrected for heart rate) suggests risk of torsades de pointes. In future versions, we could add presets for common pathologies to help learners recognize abnormal patterns.
Interactive Highlighting System
The highlighting system uses a color-coding scheme that maps to the three categories of ECG components. This visual distinction helps learners understand which type of measurement they're looking at.
- Blue — Individual waves (P, Q, R, S, T, U, J). These are the actual deflections.
- Red — Segments (PQ, ST, TU). These are the flat, isoelectric periods between waves.
- Green — Intervals (PR, QRS, QT, QTU). These are composite measurements spanning multiple regions.
1// Get highlight color based on active region type2const getHighlightColor = useCallback((): string => {3 if (!activeRegion) return "oklch(70.7% 0.165 254.624)"; // Default blue4 5 // Segments (PQ, ST, TU) get red6 if (activeRegion === "PQ" || activeRegion === "ST" || activeRegion === "TU") {7 return "rgb(248, 113, 113)"; // red-4008 }9 10 // Intervals get green11 if (12 activeRegion === "PQ-interval" ||13 activeRegion === "QRS" ||14 activeRegion === "QT" ||15 activeRegion === "QTU" ||16 activeRegion === "TP-interval"17 ) {18 return "rgb(74, 222, 128)"; // green-40019 }20 21 // Waves (P, Q, R, S, T, U) get blue22 return "rgb(96, 165, 250)"; // blue-40023}, [activeRegion]);The color system provides instant visual feedback about the type of measurement.
Interval Matching Logic
Intervals are the most complex to highlight because they span multiple regions. When a user hovers over "QT interval", we need to highlight Q + R + S + ST segment + T wave. The interval matching function handles this mapping.
1// Calculate regions for intervals (composite regions)2const getIntervalRegion = useCallback(3 (region: ActiveRegion): boolean => {4 if (activeRegion === "PQ-interval") {5 return region === "P" || region === "PQ";6 }7 if (activeRegion === "QRS") {8 return region === "Q" || region === "R" || region === "S";9 }10 if (activeRegion === "QT") {11 return (12 region === "Q" ||13 region === "R" ||14 region === "S" ||15 region === "ST" ||16 region === "T"17 );18 }19 if (activeRegion === "QTU") {20 return (21 region === "Q" || region === "R" || region === "S" ||22 region === "ST" || region === "T" || region === "TU" || region === "U"23 );24 }25 if (activeRegion === "TP-interval" || activeRegion === "TP") {26 return region === "TU" || region === "U" || region === "TP";27 }28 return false;29 },30 [activeRegion]31);The QT interval spans 5 distinct regions and this function maps them all.
Why QT Matters
The QT interval is one of the most clinically significant measurements. It represents the total time for ventricular depolarization and repolarization. QT prolongation, whether from medications, electrolyte imbalances, or genetic conditions, can predispose patients to life-threatening arrhythmias like torsades de pointes. Being able to visualize exactly what the QT interval encompasses helps learners understand why we measure it.
Chart.js Custom Plugin Deep-Dive
Chart.js plugins are powerful tools for extending the library's functionality. Our annotation plugin draws directly on the canvas during specific phases of the chart's render cycle. Understanding the two-phase drawing approach is key to getting annotations and highlights to appear correctly.
- beforeDatasetsDraw — Executes before the line is drawn. We draw highlight rectangles here so they appear BEHIND the waveform.
- afterDatasetsDraw — Executes after the line is drawn. We draw labels, annotations, and the interval timeline here so they appear ON TOP.
1// Custom annotation plugin structure2const annotationPlugin: Plugin<"line"> = useMemo(3 () => ({4 id: "waveAnnotations",5 6 beforeDatasetsDraw: (chart) => {7 // Draw highlight rectangles BEHIND the waveform8 const currentActiveRegion = activeRegionRef.current;9 if (!currentActiveRegion) return;10 11 const ctx = chart.ctx;12 const chartArea = chart.chartArea;13 14 ctx.save();15 ctx.globalAlpha = 0.2; // Semi-transparent16 ctx.fillStyle = highlightColor;17 18 // Find and draw rectangles for all highlighted regions19 highlightRanges.forEach(({ start, end }) => {20 const startX = xAxis.getPixelForValue(start);21 const endX = xAxis.getPixelForValue(end);22 ctx.fillRect(startX, chartArea.top, endX - startX, chartArea.height);23 });24 25 ctx.restore();26 },27 28 afterDatasetsDraw: (chart) => {29 // Draw labels and timeline ON TOP of the waveform30 const ctx = chart.ctx;31 32 // Draw wave labels (P, Q, R, S, T, U)33 annotationPositions.forEach(({ label, index, y, position }) => {34 const xPos = xAxis.getPixelForValue(index);35 const yPos = yAxis.getPixelForValue(y);36 // ... draw label with background37 });38 39 // Draw the interval timeline at the bottom40 if (intervalModeRef.current) {41 // Draw horizontal baseline, tick marks, and interval labels42 }43 },44 }),45 [samplesPerBeat, isMobile] // Minimal dependencies46);Two-phase drawing ensures highlights appear behind the waveform while labels appear on top.
The Ref Pattern for Plugins
The plugin is memoized with minimal dependencies, but it still needs access to frequently-changing state (like which region is active). If we put activeRegion in the dependency array, the plugin would be recreated on every hover, causing performance issues. The solution is to use refs. The plugin reads from refs instead of closure variables, so it always has the current value without needing to be recreated.
1// Keep refs in sync with state2const activeRegionRef = useRef<ActiveRegion>(null);3 4useEffect(() => {5 activeRegionRef.current = activeRegion;6}, [activeRegion]);7 8// The plugin reads from ref, not from closure9const annotationPlugin = useMemo(() => ({10 afterDatasetsDraw: (chart) => {11 // Read from ref - always gets current value12 const currentActiveRegion = activeRegionRef.current;13 14 // Plugin logic uses currentActiveRegion...15 }16}), [samplesPerBeat, isMobile]); // activeRegion NOT in deps!The ref pattern lets the plugin access current state without being recreated on every change.
Performance Optimizations
With 500+ data points per beat and real-time highlighting on hover, performance matters. Here are the key optimizations that keep the component snappy.
- Pre-allocated arrays — Creating arrays with `new Array(totalSamples)` is ~25% faster than pushing to empty arrays.
- Memoized waveform data — Waveform generation only runs when parameters change, not on every render.
- Ref-based state for plugins — Avoids recreating the Chart.js plugin on every state change.
- Mobile-specific optimizations — Reduced font sizes, disabled tooltips on touch devices, simplified annotations.
1// Generate ECG waveform data with pre-allocated arrays2const waveformData = useMemo(() => {3 // Pre-allocate arrays for better performance (~25% faster)4 const totalSamples = samplesPerBeat * waveParams.numberOfBeats;5 const data: { time: number[]; voltage: number[]; regions: ActiveRegion[] } = {6 time: new Array(totalSamples),7 voltage: new Array(totalSamples),8 regions: new Array(totalSamples),9 };10 11 // ... generation logic fills the arrays12 13 return data;14}, [waveParams, beatInterval, samplesPerBeat]);15 16// Chart data is also memoized, only recalculated when needed17const chartData: ChartData<"line"> = useMemo(() => {18 return {19 labels: waveformData.time.map((t) => t.toFixed(3)),20 datasets: [/* ... */],21 };22}, [waveformData, isHighlighted, getHighlightColor, activeRegion]);Pre-allocation and memoization keep the component performant even with hundreds of data points.
See It In Action
The interactive ECG waveform module is part of Opti-ECG's learning platform. Users can hover over buttons to highlight individual waves, segments, or intervals, and the timeline at the bottom shows how the intervals relate to each other.
Try It Yourself
Want to explore the interactive ECG waveform? It's available as part of Opti ECG's "The Normal ECG I" learning module. The interactive highlighting makes it easy to understand the relationship between waves, segments, and intervals.
Building this component was a fun exercise in combining domain knowledge with modern web development. Sometimes the best solutions come from thinking about how to structure your data rather than how to write clever algorithms. If you're building educational tools, I'd encourage you to think about what metadata would enable the interactions you want. Often, investing in data structure up front pays in implementation simplicity later.